Our Work
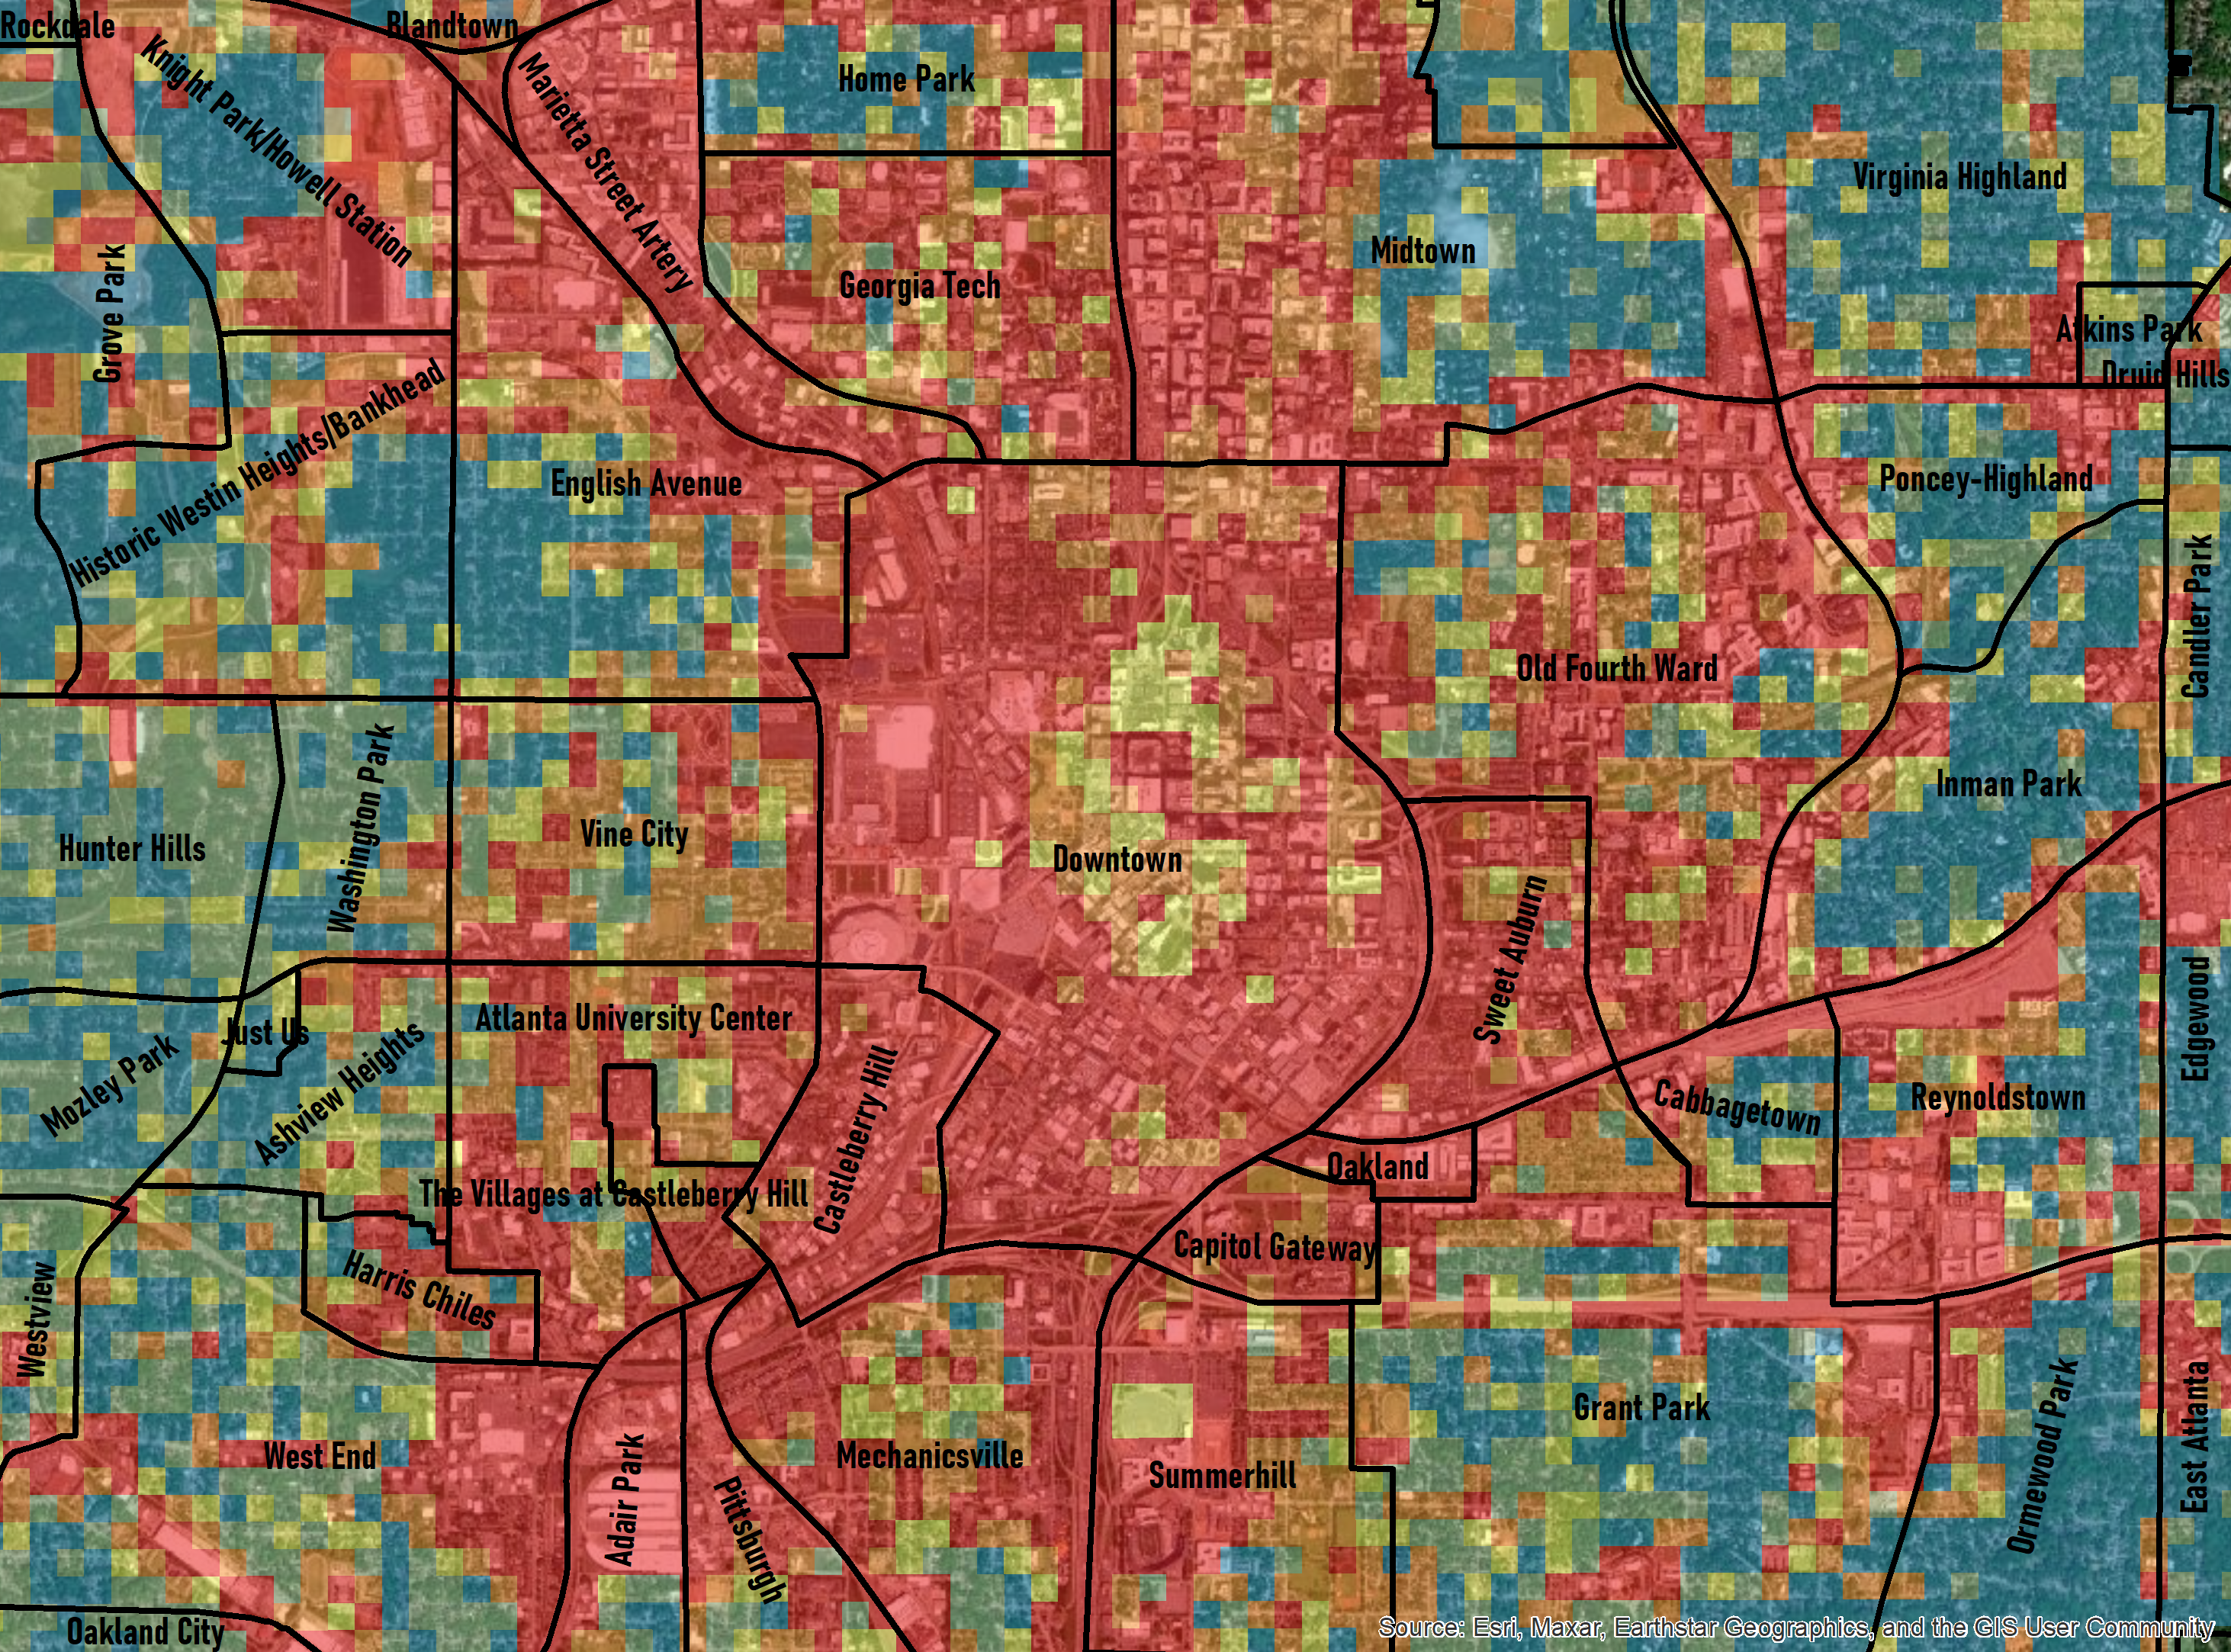
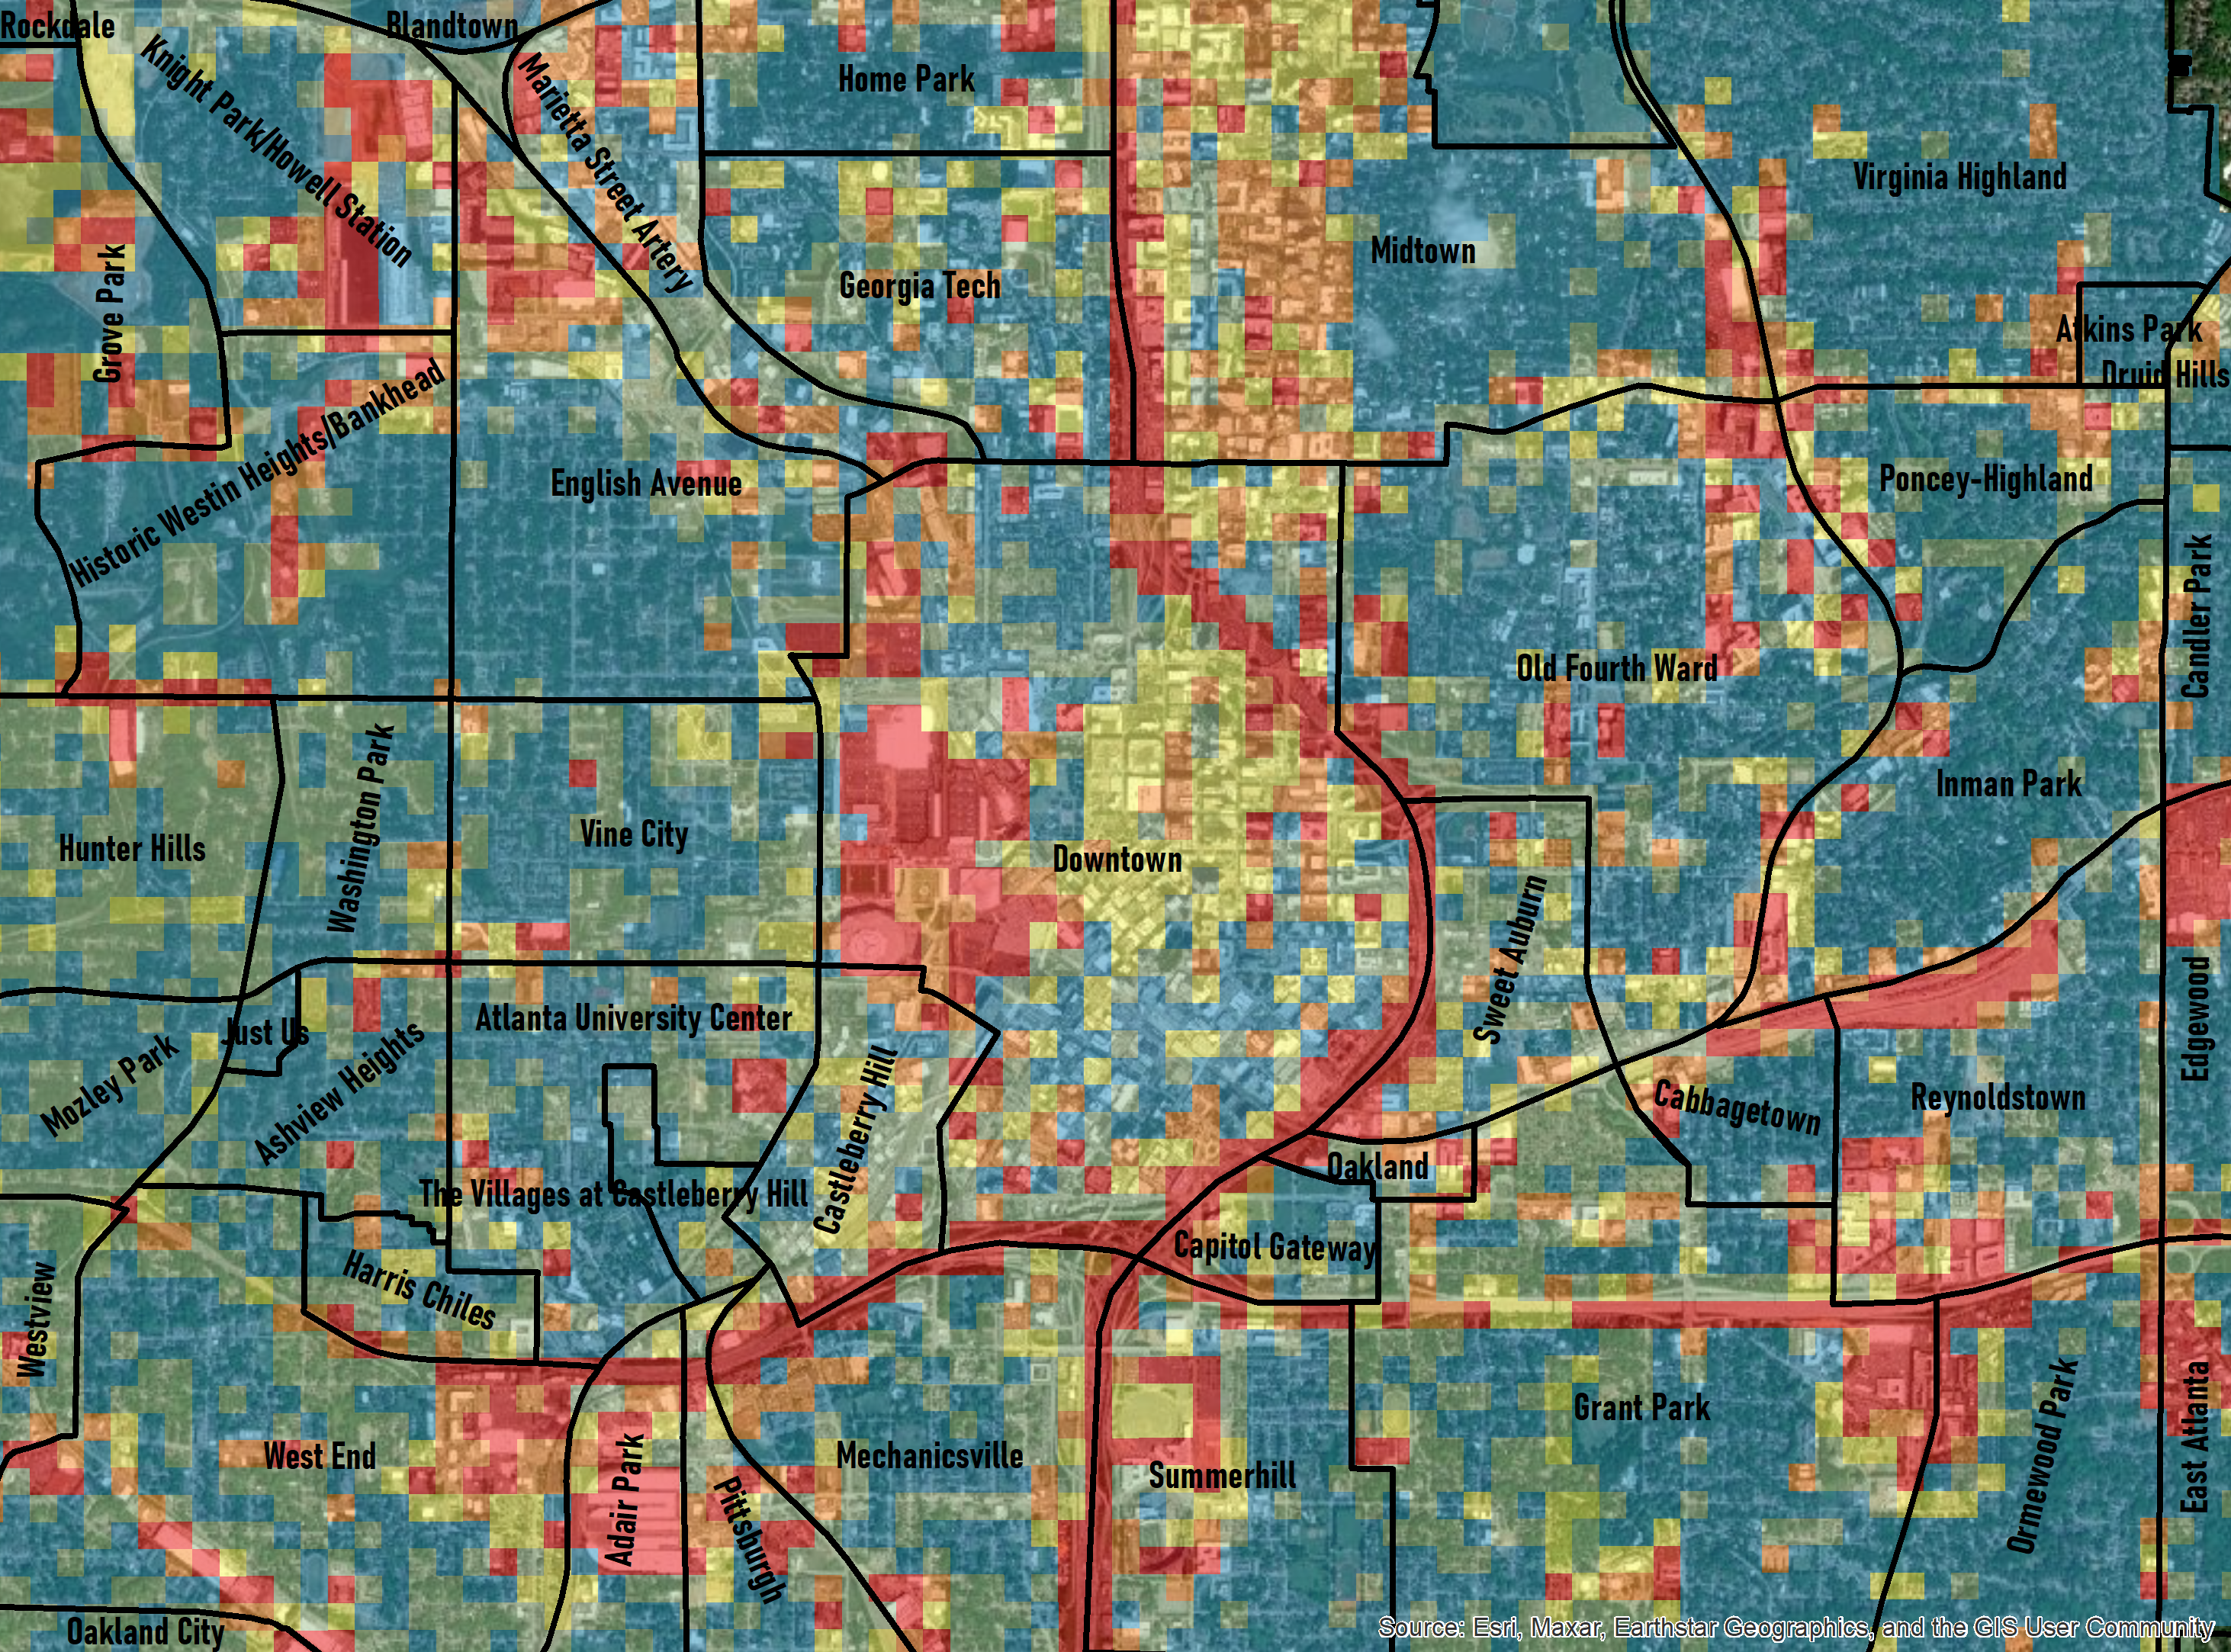
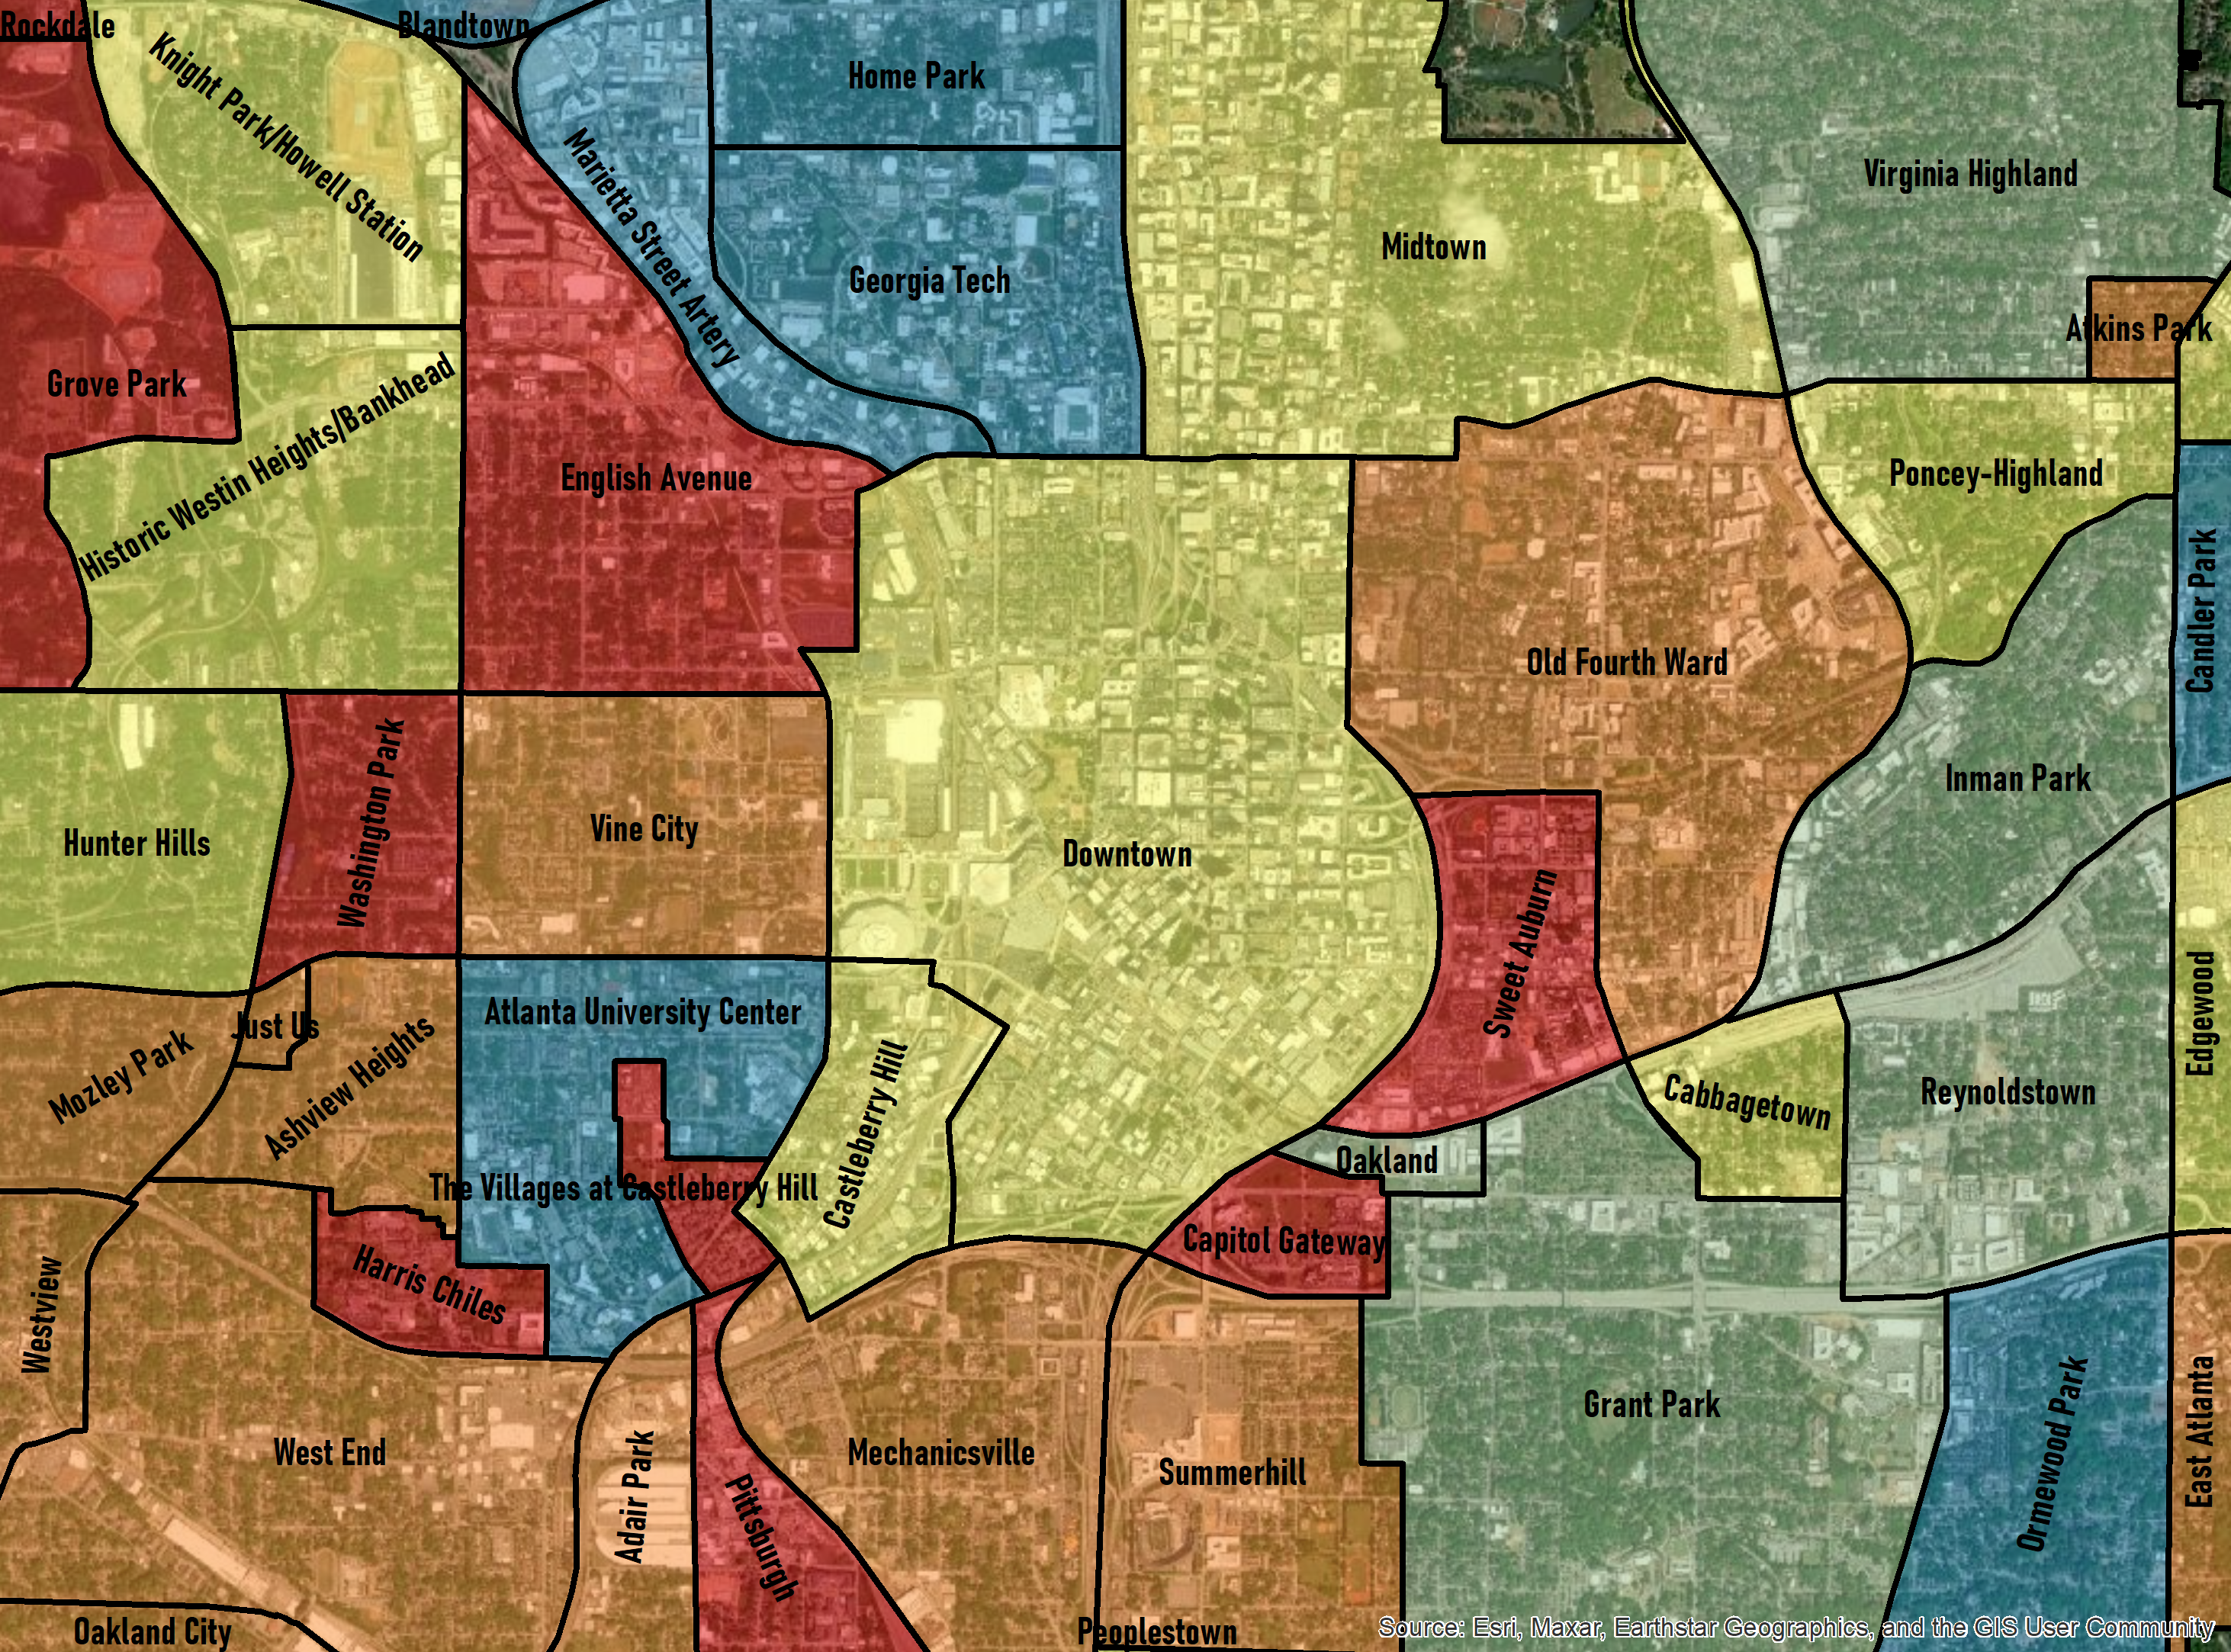
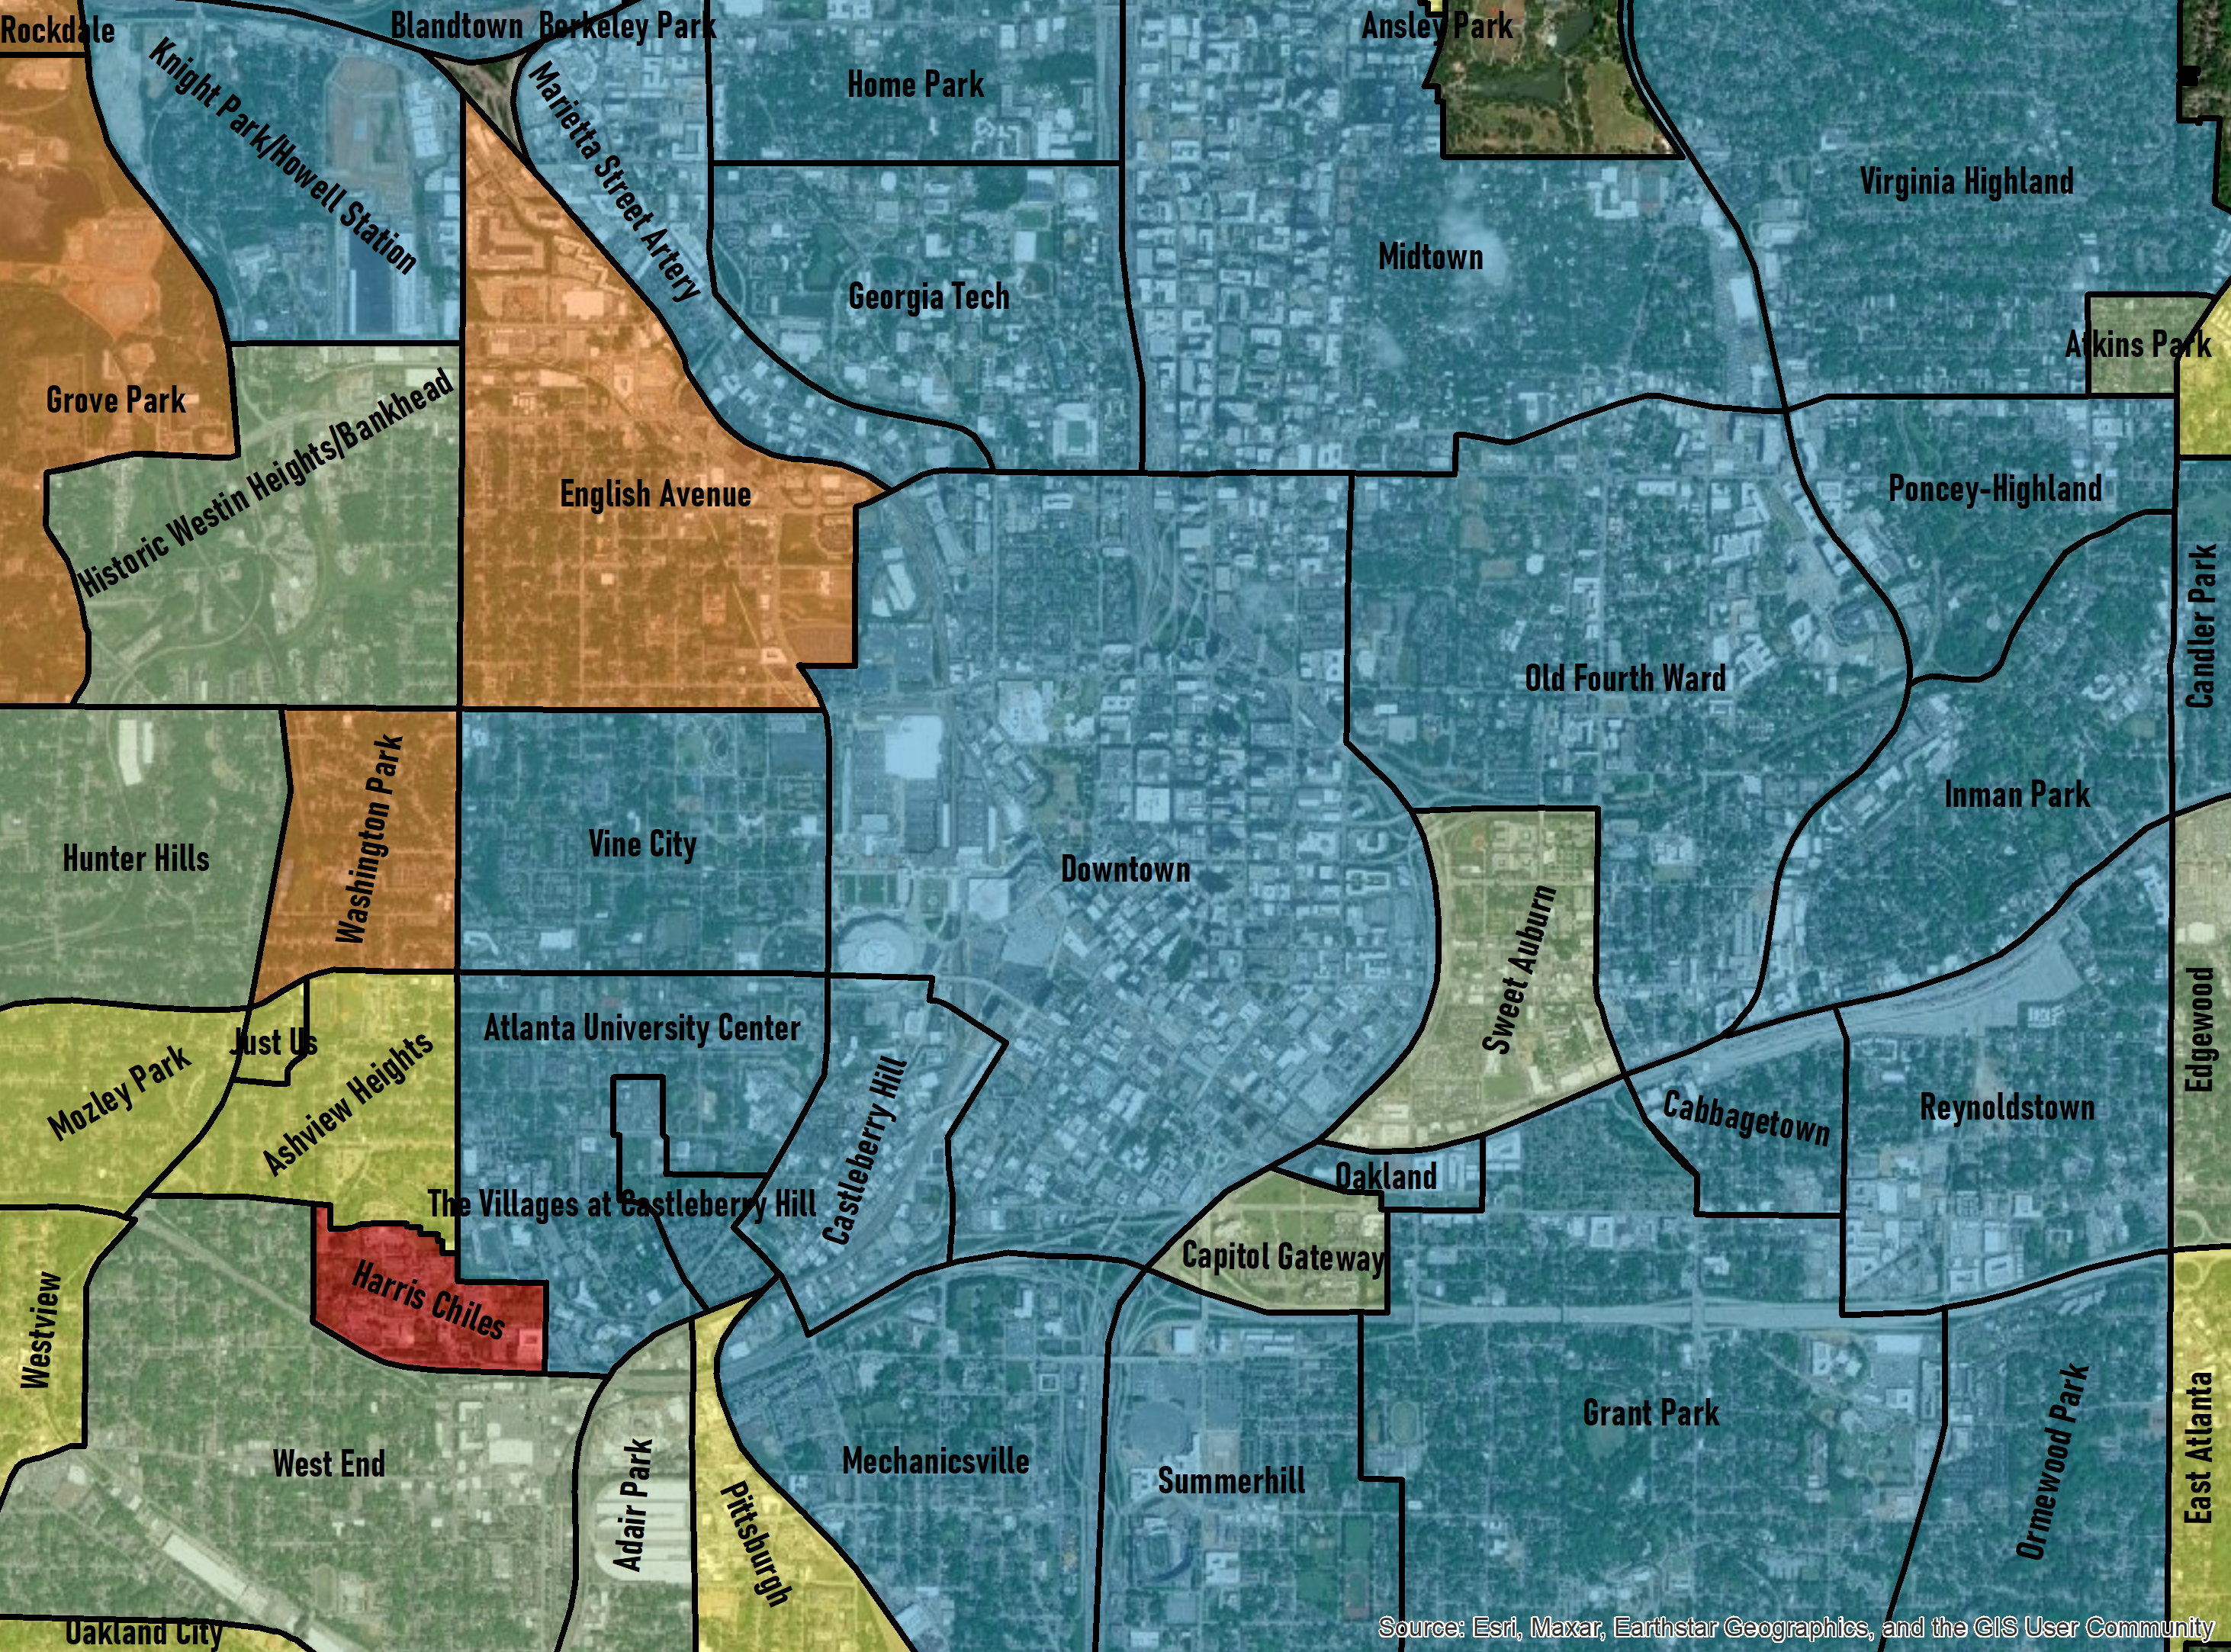
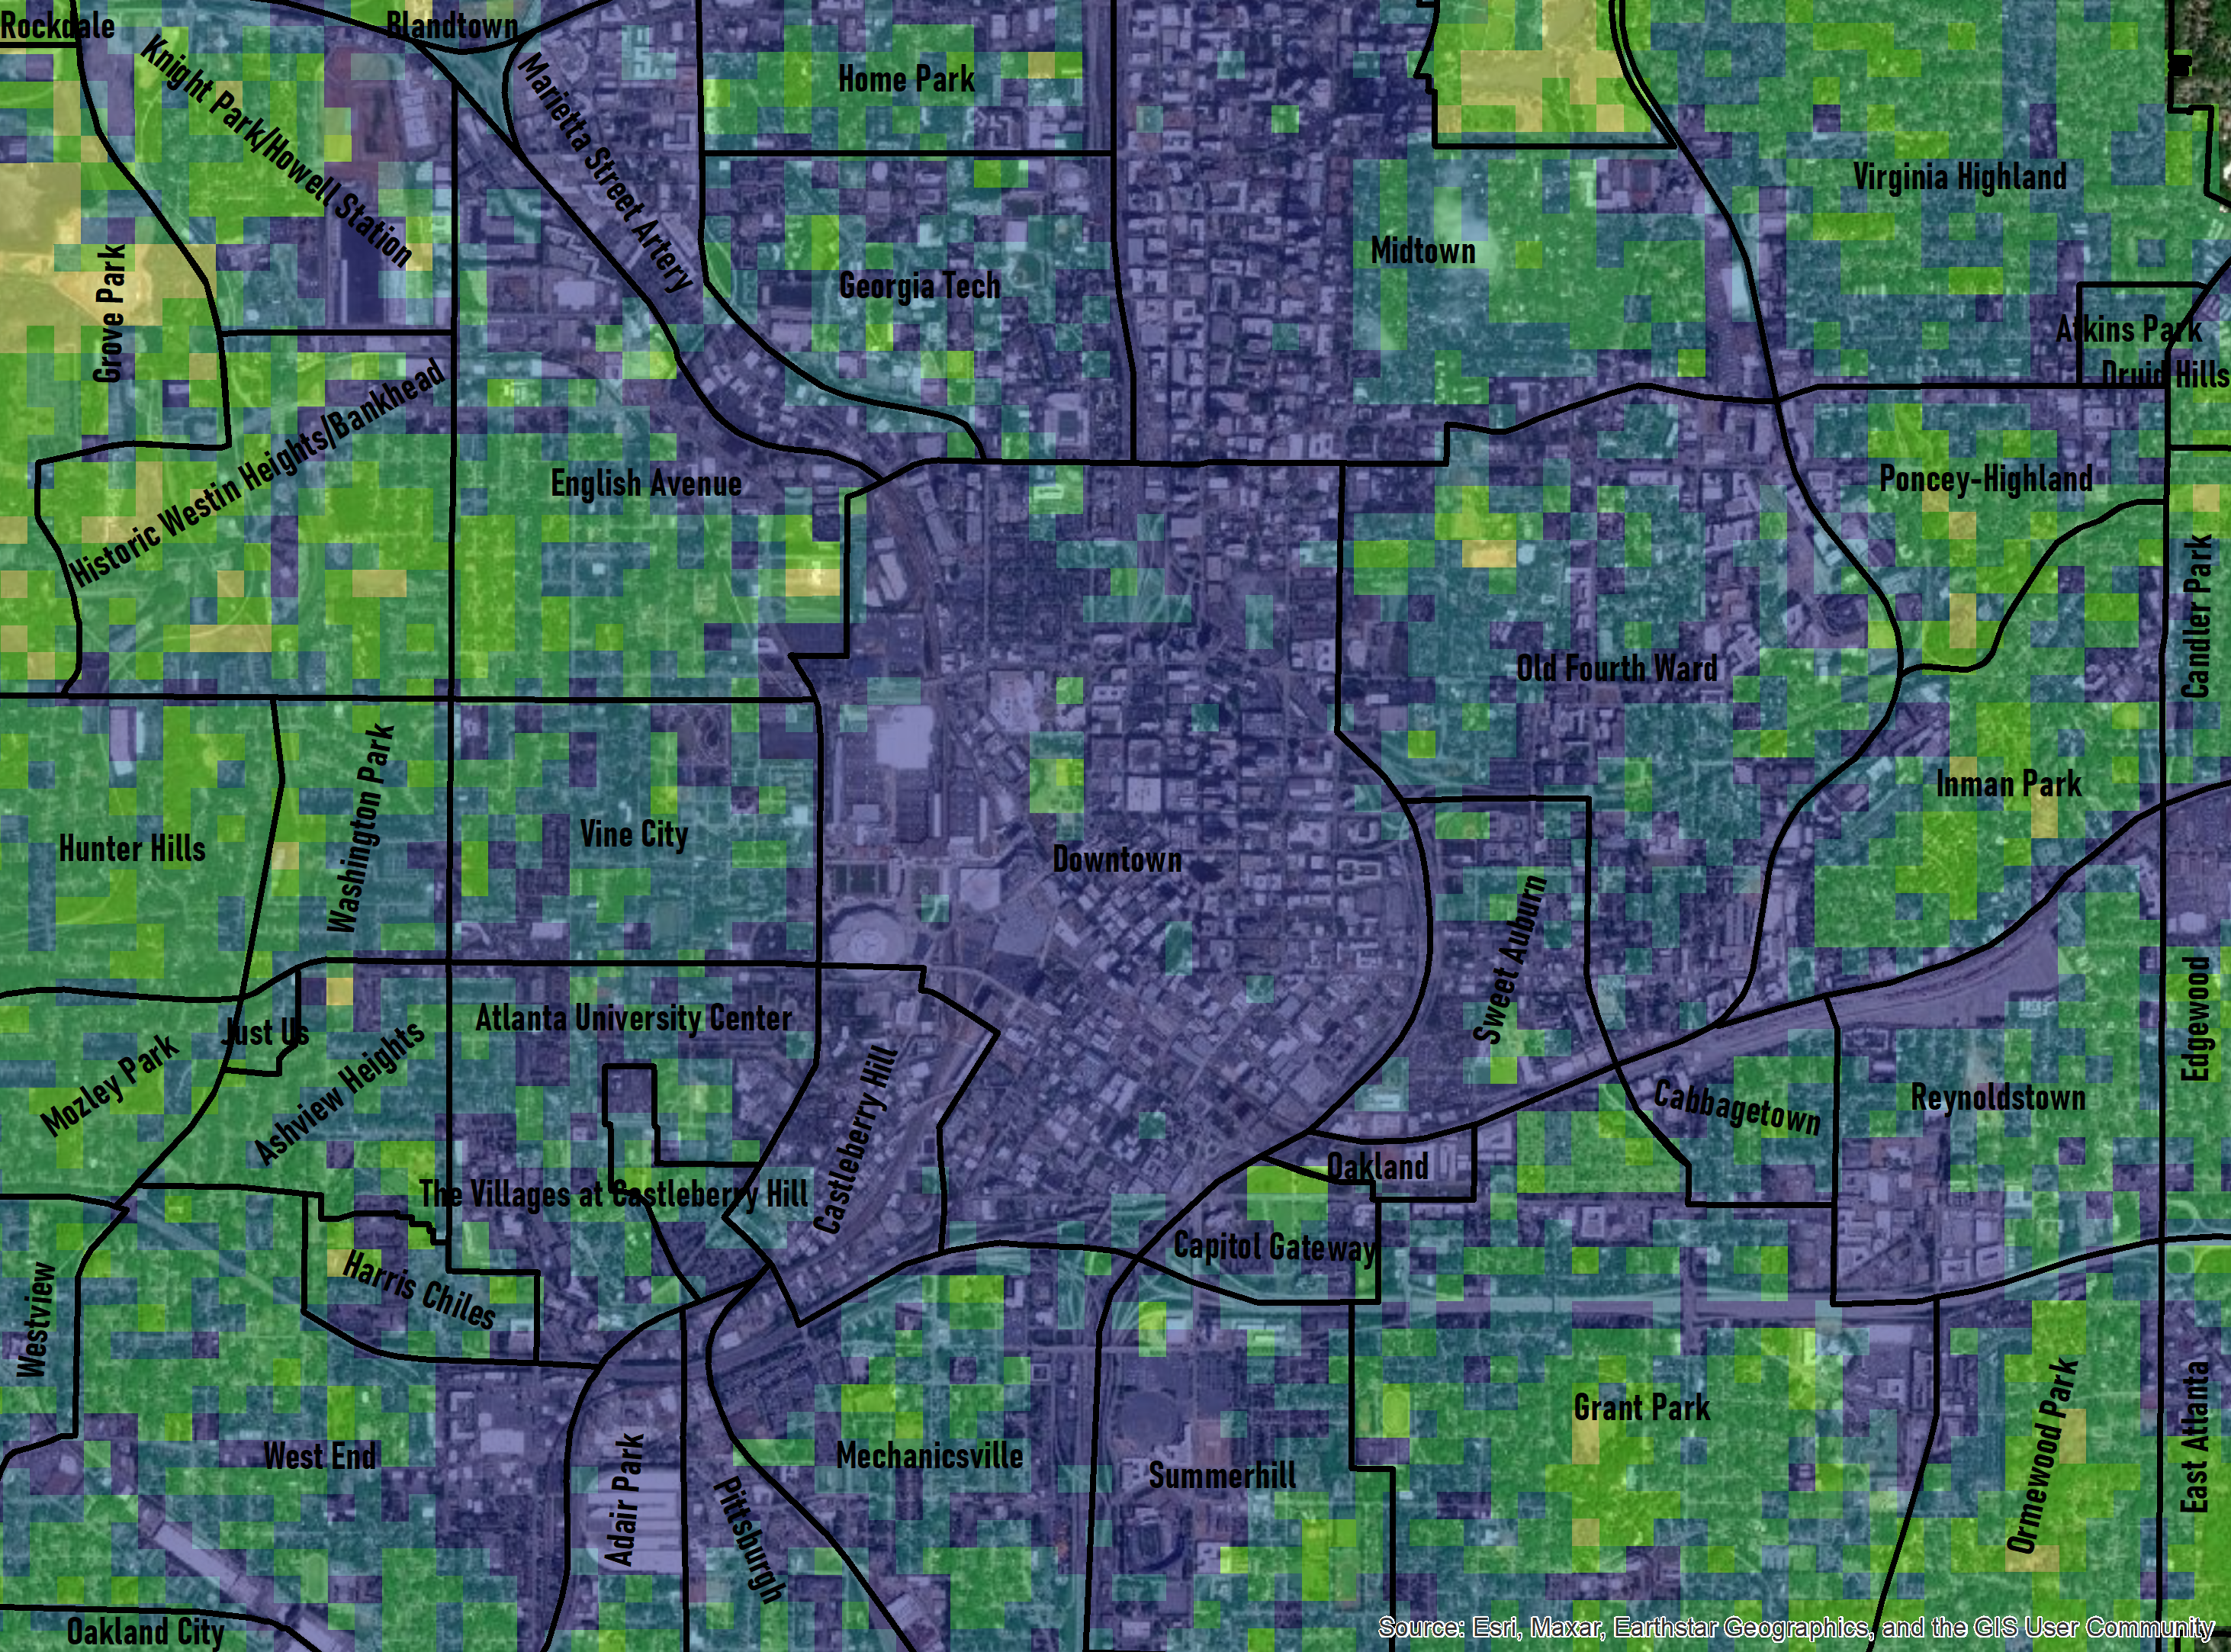
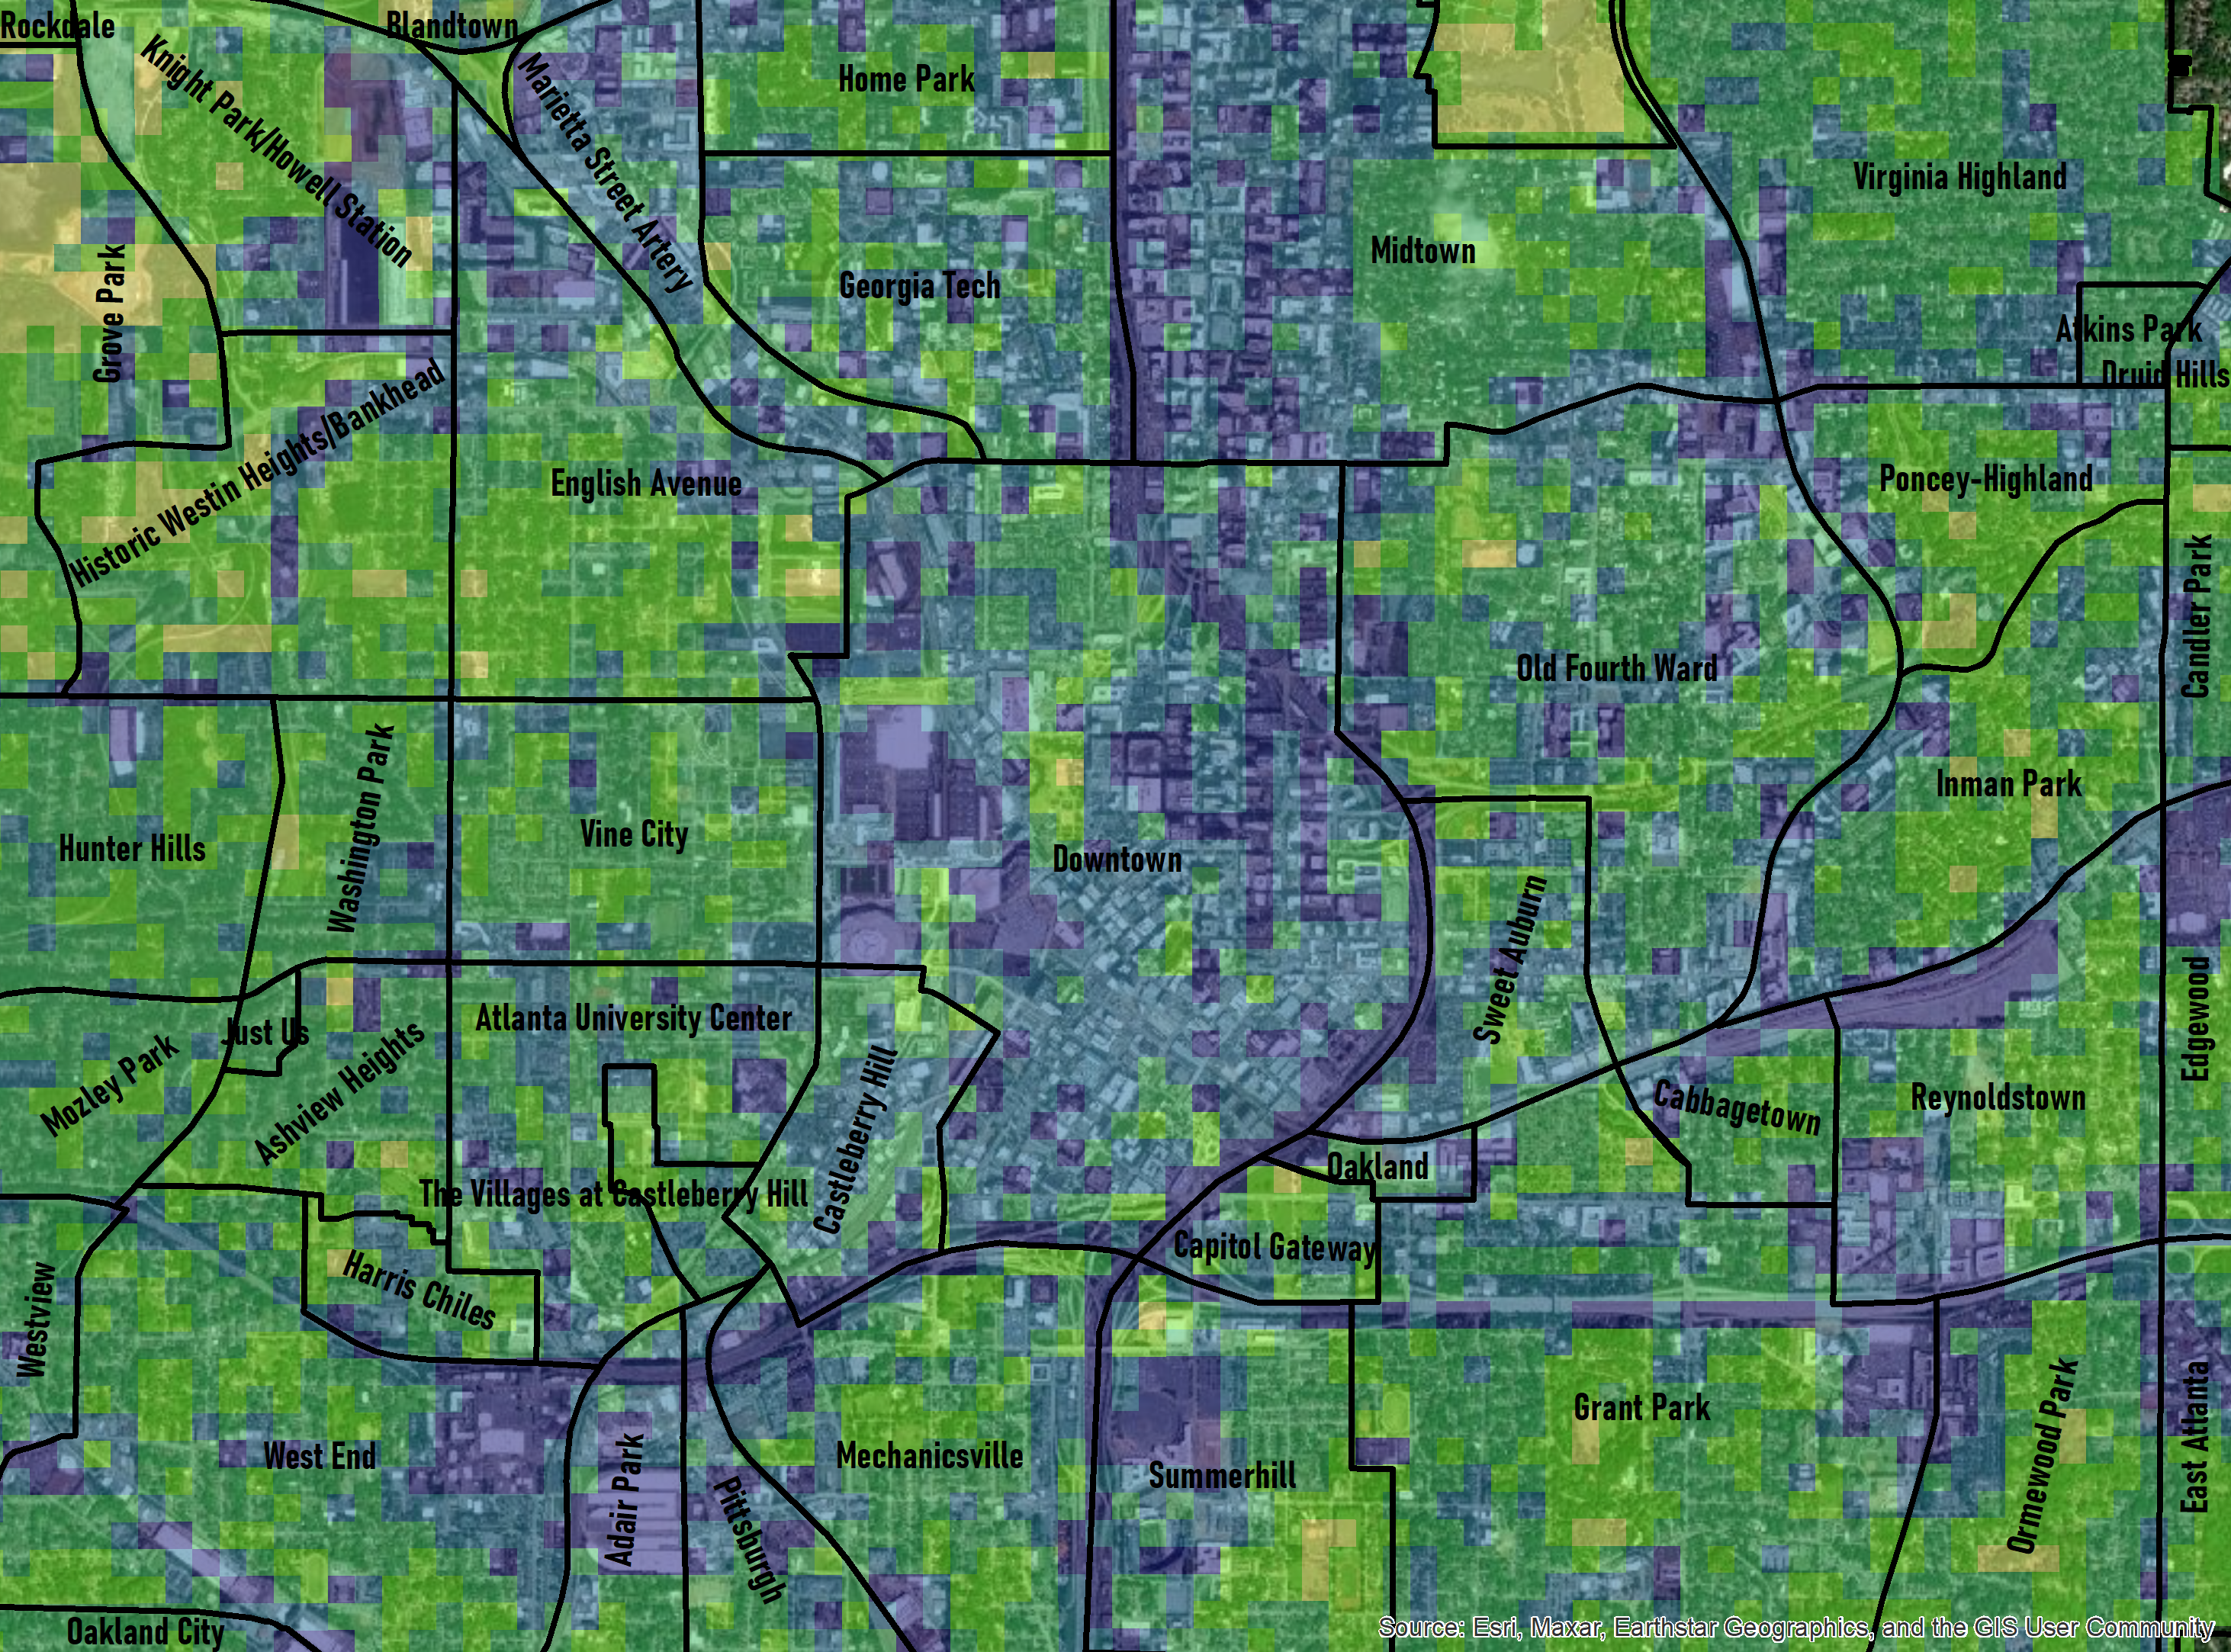
Our approach makes use of high-resolution climate modeling tools, capable of simulating air temperature and humidity levels at a resolution of up to 100m (approximately one city block), to model heat exposure across diverse urban microclimates in response to current land use conditions. Use of an urban scale climate model supports the development of a series of urban heat management scenarios, in which tree canopy and cool roofing materials may be varied by neighborhood. This approach further supports the estimation of stormwater runoff by climate adaptation scenario. Epidemiological models estimating health impacts accompany each scenario to help guide policy decisions and outcomes. Sample assessment output is presented in the following figures.
High Resolution Air Temperature Modeling
Neighborhood-Scale Health Impact Estimation
High Resolution Stormwater Runoff Modeling
Neighborhood Heat Risk Scoring based on Health Impact and Adaptive Capacity

Neighborhood-Specific Heat Management Recommendations
| Neighborhood | St Trees @ 50% | Trees @ 40% | Trees @ 50% | Trees @ 60% | Cool Roofs (SF 1000) | Rain Gardens (SF 500) | Green Roofs (SF 1000) |
|---|---|---|---|---|---|---|---|
| Adair Park | 735 | 293 | 2,254 | 4,215 | 1,603 | 201 | 222 |
| Ashview Heights | 726 | - | 1,193 | 2,563 | 600 | 49 | 80 |
| Atkins Park | 190 | - | 441 | 913 | 368 | 42 | 49 |
| Blandtown | 1,206 | 5,683 | 9,963 | 14,242 | 2,839 | 754 | 379 |
| Cabbagetown | 785 | 1,808 | 3,076 | 4,343 | 661 | 218 | 88 |
| Candler Park | 937 | - | - | 3,551 | 1,724 | 165 | 230 |
| Capitol Gateway | 676 | 1,950 | 2,612 | 3,273 | 301 | 85 | 37 |
| Castleberry Hill | 1,625 | 5,532 | 7,246 | 8,960 | 1,266 | 380 | 169 |
| Downtown | 8,149 | 22,492 | 29,848 | 37,205 | 6,403 | 1,470 | 1,668 |